Sunday, December 28, 2014

2015 Predictions: World War 3 Could Be Inevitable As Russia Leads World Into New Kind Of Conflict

Predictions for 2015 point to the possibility of World War 3 as tensions between Russia and neighboring countries — as well as the United States — appear to be reaching a boiling point.
In the past several months, Russia has taken an ultra-aggressive stance toward neighboring countries, sending troops into Ukraine to support pro-Russia rebels, conducting nuclear exercises, and sending dozens of airplanes toward neighboring airspaces in an attempt to test NATO defenses.
Now some experts predict that the tensions could eventually turn into World War 3 in the coming year, though it may look drastically different from the first two World Wars.
Dr. Philippa Malmgren, a former presidential adviser and member of the U.S. President’s Working Group on Financial Markets, said in an interview with King World News that the United States could enter a large-scale conflict that utilizes a heavy focus on the use of technology.
Malmgren said the recent military activity by Russia may have been part of this new conflict.
“The United States, Russia, and China are all vying for dominance over high-altitude satellites, which dominate all the guidance and communications systems for the conduct of warfare. And increasingly (we are seeing) stealthy methods of conducting conflict.
“For example, the Russians have been very active recently in showing their dominance in the Baltic Sea, which dictates who dominants Scandinavia and the Baltic countries. And in doing that, it’s not that they have so many ships or better quality ships, it’s how effectively they’ve been able to show they can take territory if they want to.
“The Danes released a report showing that during the largest naval exercise held last summer by the Russians, since the Soviet period, in part what they were doing was practicing taking and seizing an island in the Baltic which currently belongs to Denmark. And it was so interesting they (Russia) picked the very week that the Danes held the equivalent of Davos — the meeting where every single political leader in that nation happens to be on that island at that time.
But other 2015 predictions point toward a real World War 3, with Ukraine being the flash point. The long-simmering conflict does not appear to be reaching a solution, which was highlighted this week when peace talks were called off. Ukrainian officials have accused Russia of threatening to use nuclear weapons if the conflict were to drag on too long.

Read more at http://www.inquisitr.com/1706774/2015-predictions-world-war-3-could-be-inevitable-as-russia-leads-world-into-new-kind-of-conflict/#IADxxhpgM5bXXAty.99

Thursday, December 25, 2014

Russia Admits WW3 Is Coming! ‘There Is A War Coming In Europe’ Tuesday, July 29, 2014 7:10


By Susan Duclos


One statement reported on by FT basically says it all, making it clear that Russia is gearing up for World War III and there is nothing that can stop it at this point.


The initial story is about the recent news of a $50 billion judgement against Russia, and the details of that can be seen at the FT article(free subscription) and in the video below, but it is the last paragraph of the FT article about a statement made by a person close to Russian President Vladimir Putin, that really brings the reality of what is coming, home.


One person close to Mr Putin said the Yukos ruling was insignificant in light of the bigger geopolitical stand-off over Ukraine. “There is a war coming in Europe,” he said. “Do you really think this matters?

That is what everyone has been gearing up for. That is why the Ukraine situation was set up, orchestrated and preparations are being made to pull out old war plans from the cold war era.


WW III is what all of it has been about and we were warned consistently that this would happen because when global economies are ready to crash, war is the option TPTB always fall back to.


MAJOR UPDATE – Mother Of All Bombshells! Huge US Military Buildup In Ukraine – “This Is All Looking Pretty Ugly” – Gregory Mannarino


Sign Up To Live Free or Die and Susan Duclos’ News Letter! For all our latest articles delivered once a day.

http://beforeitsnews.com/war-and-conflict/2014/07/russia-admits-ww3-is-coming-2453412.html


Friday, December 12, 2014

Indian Industrial Production, Surprise everyone going below zero


            The Indian Industrial Production (IIP) came at minus 4.2 %; the expectation was at 2.4% just near the previous release of 2.5%. It was not alone to blow the economy. Other data were also equally negative which will hit the growth of the Indian economy. Forex Reserves fell to US 314.66 billion from the previous release of US 316.31 billion, drop by US 1.65 billion. The holding of the reserve is reduced due to the heavy balance of payment adjustments. Manufacturing output came at negative 7.6% from the previous release of 2.5%, shows the manufacturing growth in the economy is falling sharply. Consumer price index came at 4.38% from the previous release of 5.52% just below the expectation of 4.63%; showing the consumer are looking further drop in the price of consumer goods in near future. Low impact data which came along were Cumulative Industrial Production and Deposit Growth both came lower then expectation, whereas Bank Loan growth has increase marginally. 


Tuesday, December 9, 2014

Road Ahead - Golbal Recession - NIFTY target 6600 immidiately support @ 6350, Below 6350 crash landing


Nifty from the chart we have seen an uptrend in market from March 2009 onwards, where market has taken support after the 2008 crash. In year December 2008 nifty was trading around 6300, which was all time high and suddenly market cracked due to global recession. But market recovered from the lows immediately in 2009 and again tested the higher level of 6345 same high from seen in 2008, but there was a rise in index alone, stocks prices did not recover much. Price movement from 2525 point A to 6345 point B was 3820 points. Market respected the resistance level of 6345 and retraced to point C at 4535 level, nearing the 50% retracement of 4430 deviating by 100 points. By the year end 2013 December resistance level of 4345 was breached and tested the all time high of 8665.
            If we calculate as per the theory of ABC price movement, point D of 8665 exactly comes at 161.8% expansion of the rally from point A to Point B, calculating from point C. To be precise 161.8% comes to 8700 level and nifty reverted just before breaching this level.  Now considering the fact market has rallied one way from in past three months from 7750 to recent top of 8660 there has do be a correction in market. We expect nifty should correct minimum by 50% of the rally from point C at 4535 to point D at 8665 which comes to 6600 level. This correction till 6600 will bring to the strong support of 6350 which was once considered as strong resistance. If in worst case if nifty breach and sustain its trading below 6350 on weekly basis we might look at a falling knife in market with double edged, where the panic selling will come and nifty will drift to 4500 which was point C support and next extreme case support of 3400 level.
There are many reasons for this huge correction in the financial market which is supported by following fundamentals.
·         The VIX – the ‘Volatility Index’ – has dropped to 9.3 on November 25th, the same reading last seen in 2007 where the world financial markets were ridding for the fall.
o   This is what happened after the VIX hit a low of 10.02 in February 2007. Stock markets were soaring at the time, but then got clobbered by the credit crisis and all the disastrous events that followed.
o   The VIX went on to hit an all-time high of 79.13 in October 2008, when governments were scrambling to bail out bust banks and fears were rife of a total meltdown in the world financial system.

·         Prices of Crude oil are expected to test USD 55 per barrel to USD 38 per barrel, which is supported by the excess supply from the OPEC country that is not ready to reduce the output. US have started its own Shell oil production reducing the dependability from the gulf countries. Globally the demand for crude oil is reducing from many countries as they are entering in the recession phase.
·         Countries like Japan and Europe have already entered in the recession phase, but from today’s announcement Chinas government said lower rated bonds can no longer be used as collateral, Shanghai Composite Index headed for biggest loss since August 2009
·         Federal Reserve Bank have infused huge amount of funds in to the economy in the form of quantitative easing program, but was not able to change the intrest rate which is still at all time low. Although the Unemployment and Labor market are showing sigh of improvement, inflation is still at the lower level. Dollar index is trading positive in last 6 months, is well above 89 but is failing to hold the higher level where 90 is expected resistance level.  Till the time we do not see any improvement in Inflation figure, sustainability of the growth will be doubt and if this happens Dollar will also fall with global growth slowdown.
·         Dow Jones is continuously trading higher from the bottom of 2009, with a small correction was seen in mid 2011. There was not such a huge change in fundamentals, but the funds which came in form of quantitative easing went to the stock market. And once the bubble which is expected to bust might bring the greater panic then what we have seen in 2008. If this happen then we might not look at sharp reversal what we have seen in 2009, but we will be consolidating at the lower level fighting for the growth.
Presently we are the ‘Peak’ of the economic cycle, which is followed by ‘Recession’ where many countries have entered into the phase where they are facing recession phase. Then there comes the ‘Trough’ where sustain near the trough will be tough time for global recovery. Sooner the recovery from trough less is the chances of entering in to the war type situation. 


Thursday, August 28, 2014

One Pager Report on NIFTY forming Rising Wedge Pattern


India 50 (Nifty50) Sell @ 7980 Stop @ 8100 TGT 7200 – 6700 - 6070   

                India 50 (Nifty 50) since 2014 May has been trading in the side way to upside moving channel and making higher high and with five consecutive high and rising support have formed the Pattern formation of Rising Wedge pattern. This pattern is still in the formation stage and only break below 7700 will confirm the down trend. Though once can take a pre decisive move and enter at current price which is near 8000 and also at the rising trend line where it has always reverted from. Suppose this pattern holds true and market trade below 7700 in September by 2nd week then we might look at the profit booking which might drag soon the market to minimum of 6660 as first support and then the level 1 target of 6070 on lower side. Height of the wedge from 7620 to 6660 is 960 points and break below 7700 will bring to support of 6740 as first support, Level I which I have taken a rise from 5990 to 7620, difference comes to 1630 points and break below 7700 target comes to 6070 as second support. Level II which I have taken from 5105 to the top of 7620 where the difference comes to 2515 points and break below 7700 bring to the target of 5185 which will be at the strongest support where value buying might comes in picture for enter in long term buying with support of 5100 was seen in August 2013.

1.        Prior Trend: In order to qualify as a reversal pattern, there must be a prior trend to reverse. The rising wedge usually forms over a 3-6 month period and can mark an intermediate or long-term trend reversal. Sometimes the current trend is totally contained within the rising wedge; other times the pattern will form after an extended advance.
2.        Upper Resistance Line: It takes at least two reaction highs to form the upper resistance line, ideally three. Each reaction high should be higher than the previous high. Lower Support Line: At least two reaction lows are required to form the lower support line. Each reaction low should be higher than the previous low.
3.        Contraction: The upper resistance line and lower support line converge as the pattern matures. The advances from the reaction lows (lower support line) become shorter and shorter, which makes the rallies unconvincing. This creates an upper resistance line that fails to keep pace with the slope of the lower support line and indicates a supply overhang as prices increase.

4.        Support Break: Bearish confirmation of the pattern does not come until the support line is broken in a convincing fashion. It is sometimes prudent to wait for a break of the previous reaction low. Once support is broken, there can sometimes be a reaction rally to test the newfound resistance level. Volume: Ideally, volume will decline as prices rise and the wedge evolves. An expansion of volume on the support line break can be taken as bearish confirmation.

One Pager Report on DE30 (DAX indices) Positional target 8500 - 8150


DE30 (DAX) Sell 9535 @ 94 Stop @ 9770 TGT 9200 – 8900 – 8500   
             
            DE30 is showing formation of AB = CD where point C has retraced by 61.8% of AB. Where point A at 10043 to point B at 8903 w, retraced by 61.8% at 9600 and is showing the sign of reversal. If we consider (1:1) movement then point D must teste minimum of 8500 level where the 100% expansion theory will be completed. If we consider 127% of AB then we may get the level of 8150 on lower side. If the theory holds true and fails to trade beyond 71.6% which comes to 9720 then we can wait for lower target as per the theory.
The Principle is that AB is the impulsive wave in the market, BC is the retracement of AB and will usually be a 61.8% (.618) retracement of AB but should not exceed a 78.6% (.718) retracement of AB. If it exceeds 78.6% te AB = BC pattern is negated. CD will then be the next wave and be equal to AB (1:1) or be a 1.27 or 1.618 extension of AB. So when trading, you look for the chart patterns which have performed the ABC formation and plot exit point D which will be equal to AB of be a 1.27 or 1.618 extension of AB.
What Is an ABCD Pattern?
Reflects the common, rhythmic style in which the market moves. A visual, geometric price/time pattern comprised of three consecutive price swings, or trends—it looks like a lightning bolt on price chart.       A leading indicator that helps determine approximately where and when to enter and exit a trade. Why Is the ABCD Pattern Important?

                Helps identify trading opportunities in any market (forex, stocks, futures, etc.), on any time frame (intraday, swing, position) and in any market condition (bullish, bearish, or range-bound markets). All other patterns are based on (include) the ABCD pattern. Highest-probability trade entry is at completion of the pattern (point D). Helps to determine the risk/reward prior to placing a trade. Convergence of several patterns—within the same time frame, or across multiple time frames--provides a stronger trade signal. 

WTI OIL one pager forming Symmetrical Triangle pattern, Near bottom support area


WTI OIL is showing sign of Symmetrical Triangle Pattern Formation where its near the lower support level at point ‘e’ around the level of 92.55$ and once this support of 92.55$ - 92$ holds reversal is expected in WTI Oil where on higher side falling trend line resistance is seen at 104$ where as crossover above the same will confirm the breakout of the pattern. If we take breakout at 104$, Expected target as the height of the triangle comes to 130$ on higher side. We expect small profit booking on the way to test the target of 130$. 

Tuesday, August 26, 2014

Bank nifty Rising Wedge and trend reversal ..


Rising wedge formation : height 15900 - 13860 = 2040 points , expected breakdown @ 14950 and after the breakdown the next target down side will be 12910 level. 

Gold Symmetrical Triangle Pattern Formation


Gold Buy @ 1279 Stop @ 1230 TGT 1350 – 1425 - 1527
Gold is showing sign of Symmetrical Triangle Pattern Formation where its near the lower support level at point ‘e’ around the level of 1273$ and once this support of 1270 – 1273$ holds reversal is expected in gold where on higher side falling trend line resistance is seen at 1320 and 1350 where as crossover above the same will confirm the breakout of the pattern. If we take breakout at 1320$, Expected target as the height of the triangle comes to 1527$ on higher side. We expect small profit booking on the way to test the target of 1527$. 

Generally, a triangle pattern is considered to be a continuation or consolidation pattern. Sometimes, however, the formation marks a reversal of a trend.
Symmetrical triangles are generally considered neutral, ascending triangles are bullish, and descending triangles are bearish. From a time perspective, triangles are usually considered to be intermediate patterns. Usually, it takes longer than a month to form a triangle. Seldom will a triangle last longer than three months. If a triangle pattern does take longer than three months to complete, Murphy advises that the formation will take on major trend significance.
A symmetrical triangle pattern is relatively easy to identify. In addition, triangle patterns can be quite reliable to trade with very low failure rates. There is a caution concerning trading these patterns, however. As mentioned previously, a triangle pattern can be either continuation or reversal patterns. Typically, they are continuation patterns. To achieve the reliability for which the triangle is well known, technical analysts advise waiting for a clear breakout of one of the trendline defining the triangle. Volume is an important factor to consider when determining whether a formation is a true triangle. Typically, volume follows a reliable pattern: volume should diminish as the price swings back and forth between an increasingly narrow range of highs and lows. However, when breakout occurs, there should be a noticeable increase in volume. If this volume picture is not clear, investors should be cautious whether pattern is a true triangle.


Thursday, June 19, 2014

Diamond Pattern Formation in INDIA NIFTY 50


INDIA 50 Sell below 7550 CMP 7580 Stop @ 7650 TGT 7300 – 7050 - 6650

Diamond top formation

A diamond top formation is a pattern in technical analysis that is used to identify a possible end to an uptrend. This pattern is identified by drawing a line from the peak price to an existing lower high and another line from the highest low price down to the lower low. It ultimately forms a descending channel, but the lines drawn from the last uptrend to the peak and the latest lower low to the lower high takes the shape of a diamond.

NIFTY is forming similar to the Diamond To formation where if sustain trading below 7555 will confirm the breakdown on closing basis and will enter in negative trend. Support trend line is the rising trend line at 7555 and once the level  is crossed next down side will be the previous bottom at 7215 and sustain below the same will bring to 7100 the rising trend line as our first target and if the same support is also broken then will test the next support level at 6650.


Banknifty forming Head & Shoulder pattern formation

Bank nifty Sell CMP @ 15250 stop @ 15800 tgt 14200 - 13200


Monday, June 16, 2014

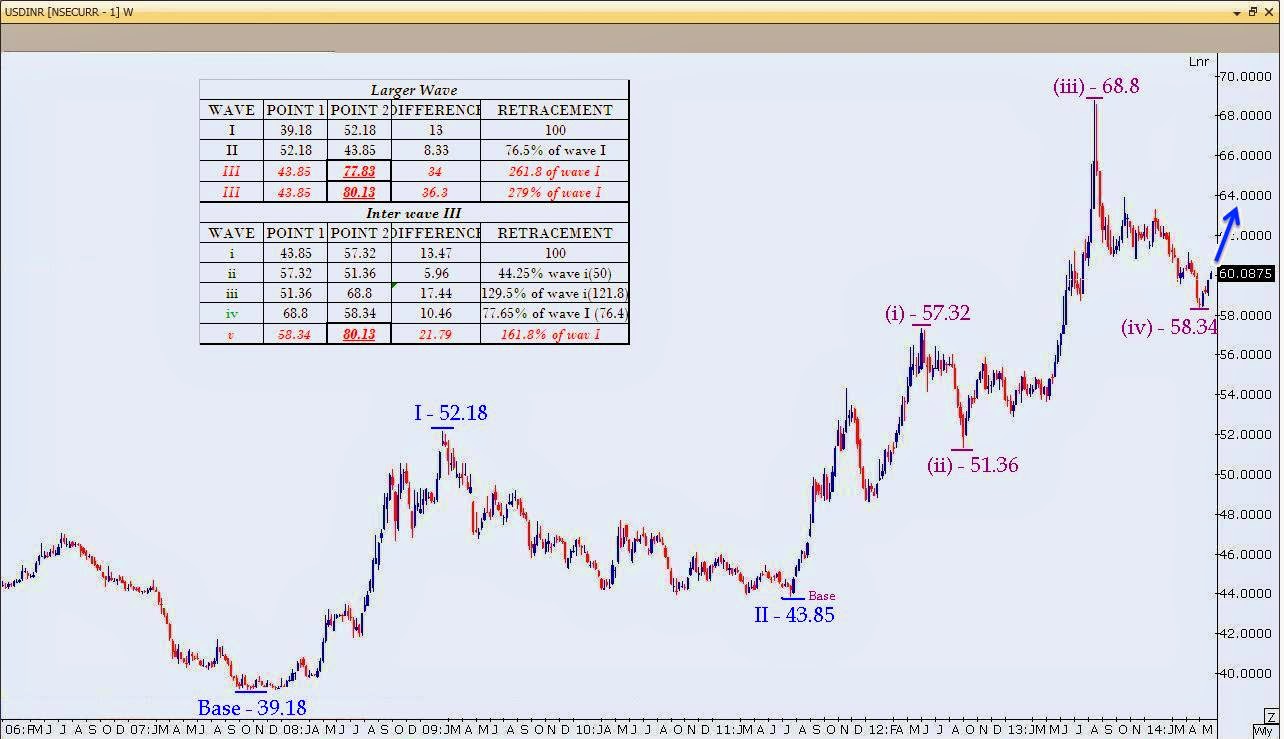
USDINR Positional Report Elliot wave pattern formation


USD/INR Buy CMP 60.1 Stop @ 58 TGT 64 – 68 – 72 – 76 – 80
 The basic pattern of the Elliott wave principle, how price moves not in a straight line but in a series of rises and retracements. Except for unusual circumstances, price moves in waves and not in a straight-line run. These waves are like the tide coming in. Price advances and recedes, advances a bit more and recedes, slowly creeping up the shore.

            USDINR from the above weekly chart from 30th November bottom of 39.18 started the rally where it tested the higher level of 52.18 in market 2009 where the top was posted. This was the first wave in the long term uptrend where the rise in price was seen by 13 Rs. After testing the level of 52.18 corrections in the form of wave II was seen and rupee retraced from 52.18 to 43.85 which was 64.07% which was near to 61.8% level, which confirm correction was over and it entered in wave III on 29th July 2011 which is still in continuation. In the wave III we are looking at the inter wave formation where the inter wave, the formation of wave (iv) is near to over and is entering in wave (v) which is starting from recent bottom of 58.34 level. In the graph it is clearly shown the movement of wave (iv) and the expected wave (v) can retrace by 161.8% of wave (i) which comes to 21.79 points move from 58.34 and can move and test the level of 80.13 level on higher side. This expected level of 80.13 will complete the inter wave (v) and also the completion of wave III in larger wave. Wave III might either close near to 77.83 which comes to 161.8% of wave I or 80.13 which is 161.8% of wave (i) from bottom of wave (iv); where we can conclude wave III in larger wave can come to end near to 78 to 80 range there after wave IV can come in to picture.
            Over here we expect wave IV to retrace by 61.8% of wave I which will test 72 from the higher level of 80.13 and thereafter from the lower level of 72 will enter in the wave V moving and testing the level of 93.03 which is calculated on the basis of 161.8% of wave I from the bottom of wave IV and will halt around that level before entering in corrective formation of A-B-C wave.


o   Rule:
·         Wave III must be 1.5 & 3.5 times Price of wave I; Wave III must be 1 to 4 times the time wise by wave I; Wave II and wave IV usually alternate between
·         Zigzag and Flat. The other alternative is between a Triangle and a Flat. Wave V will usually move beyond the end of wave III.
·         When Wave 5 is extended (more than 161.8% longer than both Waves 1 and 3) a point within Wave 4 will often divide the entire Impulse Wave by 1.618.
·         It is unusual for Wave 5 to travel a greater price or time percentage than Wave 3 traveled in its entirety.
·         One of the Impulse Waves (Waves 1, 3 or 5) generally extends (at least 162% times the next longest Impulse Wave).

·         Wave 5 must move by price more than 70% of wave. (This is not gross movement. Only consider the end points of both 1 and 3 waves.)

Friday, June 13, 2014

One Pager Report on DE30 (DAX)

DAX (DE30) Sell below 9900 CMP 9930 Stop @ 10050 TGT 9300 – 8700 - 8028
 The basic pattern of the Elliott wave principle, how price moves not in a straight line but in a series of rises and retracements. Except for unusual circumstances, price moves in waves and not in a straight-line run. These waves are like the tide coming in. Price advances and recedes, advances a bit more and recedes, slowly creeping up the shore. The outgoing tide shows the wave advance not as far as previous waves, and withdrawing further. The motive phase is composed of three advancing waves, 1, 3, and 5 and counter trend waves 2 and 4. Following the motive wave comes the corrective phase. It shows two receding waves, A and C, with a counter trend wave between, B. The series, 1 through 5 and A through C can be repeated to show how the tide comes in, or price advances up the chart. If you were to zoom in on waves 1 and 2, you would see the same 1 through 5 and ABC combination. You can say the same about waves 3 and 4, 5 and A, B and C (with the structure reversed). In this manner, the cycle is fractal, meaning the closer you zoom in, the more motive and corrective phase combinations you see. If you were to zoom out, say look at the structure from across the room or from the other side of your yard, the 1 through 5 and ABC combination would take shape of waves 1 and 2.

         
   From the above monthly chart of DAX (DE30), it started its rally from 2003 bottom from the lower level of 2190 and continues its rally testing the level of 8150 by year end 2007 December where it formed Double top and in 2008 Circes sharp correction was seen. This was the correction of the rally in the form of wave II and tested the lower level of 3590 which was exactly 76.4% retracement of wave I. after the correction we have again seen the upside move in the form of wave III and in this wave III there are inter wave where in inter wave also wave iii is near to completion. Inter wave I started from 3590 and tested the level of 7600 and from 7600 the correction what we have seen is the wave ii testing the support of 4965, which is 59% retracement of wave I, near to 161.8% retracement level. Wave iii testes the level of 10033 which was 121.8% retracement of wave i and confirming the reversal in the price are expected. Now if recent high of 10033 is holding will enter in wave iv of inter wave and it’s expected to test the level of 8028 which we expect 50% retracement of wave i and holding the high of wave i above 7600 and enter in wave v of inter wave III and completion of wave III can be seen at 12050 which is 100% retracement of wave I from the bottom of  wave II, which is expected in long run where.  

UK100 Indices Symmetrical triangle pattern. Target 6675


UK 100 Sell Below 6800 CMP 6830 Stop @ 6875 TGT 6725 - 6675

A Symmetrical Continuation Triangle (Bearish) is considered a bearish signal, indicating that the current downtrend may continue.

Description
A Symmetrical Continuation Triangle (Bearish) shows two converging trendlines, the lower one is ascending, the upper one is descending. The formation occurs because prices are reaching both lower highs and higher lows. The pattern will display two highs touching the upper (descending) trendline and two lows touching the lower (ascending) trendline. This pattern is confirmed when the price breaks out of the triangle formation to close below the lower (ascending) trendline.

Target Price
The target price provides an important indication about the potential price move that this pattern indicates. Consider whether the target price for this pattern is sufficient to provide adequate returns after your costs (such as commissions) have been taken into account. A good rule of thumb is that the target price must indicate a potential return of greater than 5% before a pattern should be considered useful. However you must consider the current price and the volume of shares you intend to trade. Also, check that the target price has not already been achieved.


UK100 is forming Symmetrical triangle pattern formation from the high of 6895 and support of 6771 and after it enter in the range bound, where it made lower top and higher bottom formation. It’s nearing the lower support level of 6800 and sustain below 6800 on closing basis it will give a confirmation of the breakdown of the triangle. Height of the triangle comes to 124 points (6895 - 6771) and calculation the target from the breakdown point of 6800(6800 - 124 = 1217) expected target comes to 6676$ in near to medium term. Below 6676 might go and test the previous bottom of 6550 – 6500 level. 

Tuesday, June 3, 2014

Bank nifty forming Head & Shoulder pattern in intrday 3 min time frame for 14900 target CMP is 14240

bank nifty in intraday 3 min chart time frame forming Head& Shoulder Pattern where neck line is coming at 15180 and sustain below the same will give the down side breakdown and can move and test the support level of 14900 immediately, on higher side resistance and stop of 14400 is advise ,, Rajeev darji +91-9820987859

Tuesday, May 27, 2014

Symmetrical Triangle Pattern Formation in GOLD


GOLD Sell Below 1285 CMP 1287Stop @ 1300 TGT 1265 – 1245 – 1217

A Symmetrical Continuation Triangle (Bearish) is considered a bearish signal, indicating that the current downtrend may continue.

Description
A Symmetrical Continuation Triangle (Bearish) shows two converging trendlines, the lower one is ascending, the upper one is descending. The formation occurs because prices are reaching both lower highs and higher lows. The pattern will display two highs touching the upper (descending) trendline and two lows touching the lower (ascending) trendline. This pattern is confirmed when the price breaks out of the triangle formation to close below the lower (ascending) trendline.

Target Price
The target price provides an important indication about the potential price move that this pattern indicates. Consider whether the target price for this pattern is sufficient to provide adequate returns after your costs (such as commissions) have been taken into account. A good rule of thumb is that the target price must indicate a potential return of greater than 5% before a pattern should be considered useful. However you must consider the current price and the volume of shares you intend to trade. Also, check that the target price has not already been achieved.

Gold is forming Symmetrical triangle pattern formation from the high of 1331 and support of 1268 and after it enter in the range bound, where it made lower top and higher bottom formation. It’s nearing the lower support level of 1285 and sustain below 1285 on closing basis it will give a confirmation of the breakdown of the triangle. Height of the triangle comes to 68 points (1331 – 1268) and calculation the target from the breakdown point of 1285 (1285 -68 = 1217) expected target comes to 1217$ in near to medium term.


Friday, May 23, 2014

One Pager Positional Report on WTI OIL


WTI OIL BUY @ 104 CMP stop @ 101 TGT 108 – 111  :- Wave III completion

                The basic pattern of the Elliott wave principle, how price moves not in a straight line but in a series of rises and retracements. Except for unusual circumstances, price moves in waves and not in a straight-line run. These waves are like the tide coming in. Price advances and recedes, advances a bit more and recedes, slowly creeping up the shore. The outgoing tide shows the wave advance not as far as previous waves, and withdrawing further. The motive phase is composed of three advancing waves, 1, 3, and 5 and counter trend waves 2 and 4. Following the motive wave comes the corrective phase. It shows two receding waves, A and C, with a counter trend wave between, B. The series, 1 through 5 and A through C can be repeated to show how the tide comes in, or price advances up the chart. If you were to zoom in on waves 1 and 2, you would see the same 1 through 5 and ABC combination. You can say the same about waves 3 and 4, 5 and A, B and C (with the structure reversed). In this manner, the cycle is fractal, meaning the closer you zoom in, the more motive and corrective phase combinations you see. If you were to zoom out, say look at the structure from across the room or from the other side of your yard, the 1 through 5 and ABC combination would take shape of waves 1 and 2.


            From the above chart WTI OIL after testing the lower support at 91.75 forming Double Bottom formation and reversal in price was seen and also have crossed the neckline at 100$ and tested the higher level of 105 from where short profit booking was seen. Rise in price from 91.4 to 105.2 can be consider as wave I of the Elliot wave theory and there after correction pattern tested the level of 97 in form of wave II which was near to 61.8% retracement of wave I which was coming at 96.3, but price reverted from 97 and in showing formation of inter wave of wave III. It in inter wave its again in (iii) wave where the expected target comes to 108$ and after a short dip till 106$ in form of wave (iv) will again move to test the level of 111 – 112$ where the inter wave (v) will get over with larger wave III.

One pager positional report on NZDUSD


NZD/USD SELL @ 0.8550 CMP stop @ 1.8700 TGT 0-8350 – 0.8200 – 0.8050

                The double top is a frequent price formation at the end of a bull market. It appears as two consecutive peaks of approximately the same price on a price-versus-time chart of a market. The two peaks are separated by a minimum in price, a valley. The price level of this minimum is called the neck line of the formation. The formation is completed and confirmed when the price falls below the neck line, indicating that further price decline is imminent or highly likely.
The double top pattern shows that demand is outpacing supply (buyers predominate) up to the first top, causing prices to rise. The supply-demand balance then reverses; supply outpaces demand (sellers predominate), causing prices to fall. After a price valley, buyers again predominate and prices rise. If traders see that prices are not pushing past their level at the first top, sellers may again prevail, lowering prices and causing a double top to form. It is generally regarded as a bearish signal if prices drop below the neck line.
The time between the two peaks is also a determining factor for the existence of a double top pattern. If the tops appear at the same level but are very close in time, then the probability is high that they are part of the consolidation and the trend will resume. Volume is another indicator for interpreting this formation. Price reaches the first peak on increased volume then falls down the valley with low volume. Another attempt on the rally up to the second peak should be on a lower volume.

            From the above chart NZDUSD reverted from the level of 0.8726 forming double top formation and is nearing the support level of 0.8515 which is the neckline of the pattern and once the neckline is broken below 0.8515 will confirm the trend for the down side move. Currently its trading at 0.8540 level and on closing basis if neckline is crossed will open the door for 0.8350 – 0.8200 – 0.8050 level where the previous bottom will be tested at 0.8050 which was seen in Feb. 2013 where lower level we can wait for. 

One Pager Positional Report on EUR/USD


EUR/USD SELL @ 1.3645 stop @ 1.3950 TGT 1.3250 – 1.2850 – 1.2450 – 1.2050

            The Rising Wedge is a bearish pattern that begins wide at the bottom and contracts as prices move higher and the trading range narrows. In contrast to symmetrical triangles, which have no definitive slope and no bullish or bearish bias, rising wedges definitely slope up and have a bearish bias. Even though this article will focus on the rising wedge as a reversal pattern, the pattern can also fit into the continuation category. As a continuation pattern, the rising wedge will still slope up, but the slope will be against the prevailing downtrend. As a reversal pattern, the rising wedge will slope up and with the prevailing trend. Regardless of the type (reversal or continuation), rising wedges are bearish.
From the above chart it has been seen that EURUSD has fallen from 1.4940 Level in Feb. 2011 and tested the lower level if 1.2040 in July 2012 where in around one and a half year it has drifted by 2900 pips and after the sharp down trend EURUSD moved upside and retraced by 61.8% retracement of the fall and testing the higher level of 1.3995 at point D where closing was seen below 1.3900 level just near the 61.8% retracement which was coming at 1.3820 level. Recently its facing a good resistance at 1.4000 on breakout basis and 1.3900 on closing basis we expect down trend to continue which is seen in last two consecutive days, Initial support of 1.3720 is broken of the first trend line and is nearing the next support of 1.3480 and if the same support is broken then down trend is confirm and it’s expected to test the level of 1.2050. 


It is forming RISING WEDGE pattern formation where height of the wedge from 1.3485 to the support of 1.2040 comes to 1445 pips and we have seen initial breakdown at 1.3720 and next breakdown is seen at 1.3480. Calculating the target fall from beak down of 1.3480 the expected target comes to 1.2035 which is also the previous bottom in July 2012. Till the time EURUSD is below 1.4000 one can expect the level of 1.2050 in medium to long term, where positional trader can enter with sell position with given target of 1.2850 – 1.2050 level around profit booking in phase manner.