Tuesday, August 11, 2015

Spot USDINR: Buy Above 64.30 | Stop @ 63.50 | Target @ 65.80 — 67.30


Spot USDINR: Buy Above 64.30 | Stop @ 63.50 | Target @ 65.80 — 67.30

Spot USDINR Outlook Weak

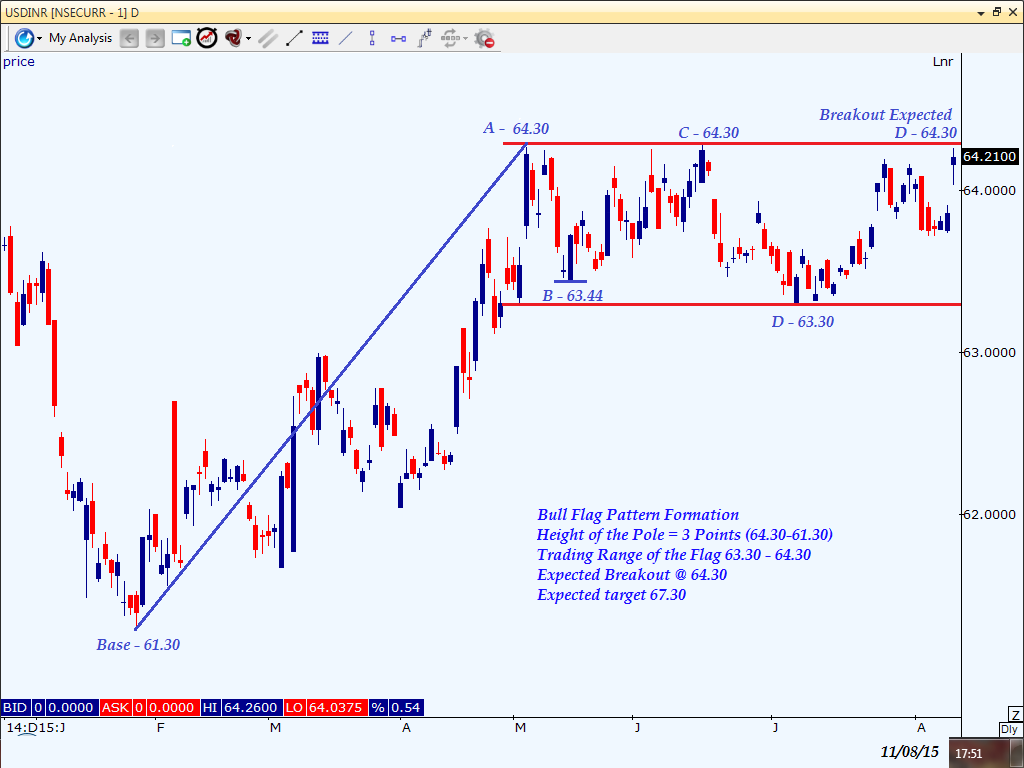
The technical chart of Spot USDINR shows Bull Flag  Pattern formation. USDINR was trading in range of one Rupee where the support was at 63.30 and resistance at 64.30 level. Rupee has risen from 61.30 seen in Feb 2015 and tested the high of 64.30 seen in May 2015 before entering in the range trading. This has given Bull Flag pattern Formation.

As per the chart pattern, if rupee sustain its trading above 64.30 level will give breakout of the Bull Flag Pattern and will get weaker again the Dollar.

Height of the Pole is 3 rupee from the lower level of 61.30 to the higher    resistance level of 64.30. Crossover above 64.30 will bring the higher target of 65.80 which is the 50% of the Pole and 67.30 which comes to 100% of the pole height. However, if it reverts from the current level of 64.21 then prices could fall to 63.50 levels.


MCX Zinc August: Sell At CMP 119.5 | Stop @ 121.5 | Target @ 115.65 — 112


MCX Zinc August: Sell At CMP 119.5 | Stop @ 121.5 | Target @ 115.65 — 112

MCX Zinc August Outlook Weak

The technical chart of MCX Zinc shows A-B-C Chart Pattern formation. Zinc reverted from the 50% retracement level yesterday and witnessed a gap down opening today due to selling pressure.

As per the chart pattern, prices might fall by 100% expansion from Point C as it was witnessed from Point A to Point B. The distance from Point A to Point B comes to 5.85 points and calculating the same from Point C, brings the initial target to 115.65.

According to the chart, a 161.8% expansion from Point C brings the target to 112 on the lower side.

If the contract crosses resistance level of 121.50 then prices may rise to 123.50 levels. However, if it reverts from the current level of 119.50 then prices could fall to 115.65 levels. A further drop to 112 isn’t ruled out if the contract breaks 115.65.