Thursday, August 13, 2015

MCX-Aluminum: Sell @ 110.90 | Stop @ 102.60 | Target @ 100 — 96.45 — 93.20


MCX-Aluminum: Sell Below 99.70 | Stop @ 102.60 | Target @ 96.45 — 93.20
Risky trader: Sell CMP 101.90 | Stop @ 102.60 | Target @ 100 — 96.45 — 93.20

MCX Aluminum Outlook Weak

The technical chart of MCX Aluminum shows Bear Flag Pattern formation. The prices has fallen from 106.20 level to the support at Point A of 99.70. Thereafter prices went in to the consolidation phase and trading was restricted within 102.60—99.70 range. Currently prices are trading at 101.90 just below the resistance level of 102.60 and is expected to move and test the support level of 99.70. This has formed a Bear Flag Pattern.

As per the chart pattern, a sustained trading below 99.70 level will give a breakdown to the Bear Flag Pattern and the Aluminum prices would weaken further.

Height of the Pole is 6.5 points, the difference between 106.20 and 99.70. A breakdown below 99.70 will bring the lower target of 96.45, which is the 50% of the Pole. The next target could be 93.20, which comes to 100% of the Pole Height.

However, if Aluminum prices reverts from the current level crossing the higher resistance level of 102.60 then the target would be 106 levels which is unlikely as of now.


Tuesday, August 11, 2015

Spot USDINR: Buy Above 64.30 | Stop @ 63.50 | Target @ 65.80 — 67.30


Spot USDINR: Buy Above 64.30 | Stop @ 63.50 | Target @ 65.80 — 67.30

Spot USDINR Outlook Weak

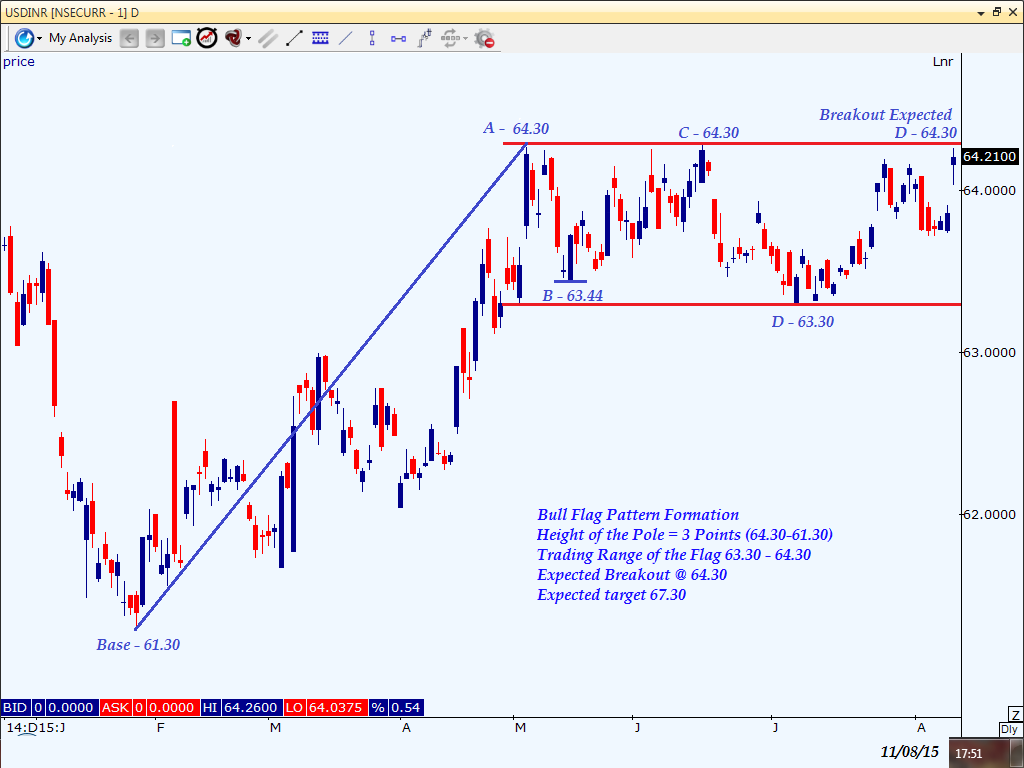
The technical chart of Spot USDINR shows Bull Flag  Pattern formation. USDINR was trading in range of one Rupee where the support was at 63.30 and resistance at 64.30 level. Rupee has risen from 61.30 seen in Feb 2015 and tested the high of 64.30 seen in May 2015 before entering in the range trading. This has given Bull Flag pattern Formation.

As per the chart pattern, if rupee sustain its trading above 64.30 level will give breakout of the Bull Flag Pattern and will get weaker again the Dollar.

Height of the Pole is 3 rupee from the lower level of 61.30 to the higher    resistance level of 64.30. Crossover above 64.30 will bring the higher target of 65.80 which is the 50% of the Pole and 67.30 which comes to 100% of the pole height. However, if it reverts from the current level of 64.21 then prices could fall to 63.50 levels.


MCX Zinc August: Sell At CMP 119.5 | Stop @ 121.5 | Target @ 115.65 — 112


MCX Zinc August: Sell At CMP 119.5 | Stop @ 121.5 | Target @ 115.65 — 112

MCX Zinc August Outlook Weak

The technical chart of MCX Zinc shows A-B-C Chart Pattern formation. Zinc reverted from the 50% retracement level yesterday and witnessed a gap down opening today due to selling pressure.

As per the chart pattern, prices might fall by 100% expansion from Point C as it was witnessed from Point A to Point B. The distance from Point A to Point B comes to 5.85 points and calculating the same from Point C, brings the initial target to 115.65.

According to the chart, a 161.8% expansion from Point C brings the target to 112 on the lower side.

If the contract crosses resistance level of 121.50 then prices may rise to 123.50 levels. However, if it reverts from the current level of 119.50 then prices could fall to 115.65 levels. A further drop to 112 isn’t ruled out if the contract breaks 115.65.


Monday, August 10, 2015

MCX Lead August: Risky Sell CMP 110.50 | Stop @ 111 | Target @ 108 – 105 – 103


MCX Lead August: Sell Below 108 | Stop @ 111 | Target @ 105-103    OR
MCX Lead August: Buy Above 111 | Stop @ 108 | Target @ 114-116    OR
MCX Lead August: Risky Sell CMP 110.50 | Stop @ 111 | Target @ 108 – 105 – 103

MCX Lead August Outlook Weak

The technical chart of MCX Lead shows Symmetrical Triangle Pattern formation. Lead is trading near the higher resistance trend line and but it’s still well within the range of Symmetrical Triangle Pattern and may give a breakout on either side. Lead prices fell from 112 (July 29) to 107.30 on August 3 and thereafter went into the consolidation phase, forming the Triangle Pattern with higher bottom and lower top.

Height of the Triangle is 4.70 points, which is the difference from 112-107.30 levels. A breakout can be seen on either side. The prices are expected to move higher if the contract crosses 110.90. However, a fall below 108 will indicate the resumption of short-term downtrend. 

If the contract crosses higher resistance level of 110.90 then prices may test 114-116 levels. But if the contract reverts from current level and trades below 108 then prices could fall to 105-103 levels, which is the height of the triangle from the Breakdown Point at 108.


Friday, August 7, 2015

WTI Oil: Outlook Remains Bearish


WTI-OIL: Sell Below $44 | Stop @ $50 | Target @ $35 — $33

WTI Oil: Outlook Remains Bearish

The technical chart indicates that WTI Oil is forming Double Bottom pattern with the support at $44/barrel level. At the starting of 2015, prices rebounded from $44 and rose to $62. During the period of May prices consolidated in the range of 62 to 56.50 during May. However, prices broke the support level of $58 in June and fell to $44.

Prices are expected to reverse if it remains above the support level of $44 and retest the level of $62 again.    However, a break below $44  may take the prices to $33, which is 61.8% retracement of the recent fall. Prices are currently at $44.50.

In 2008, prices fell from $147 and took support at $33 before reversal in early 2009  and tested the level of $115.

The market fundamentals indicate that crude oil inventory is rising due to production in the US, the Middle East, and fresh pumping of oil by Russia. This is adding to the already high Inventory stocks and prompt prices to fall in coming days.


Wednesday, August 5, 2015

Gold One Pager Report..


Instrument
S3 Pivot
S2 Pivot
S1 Pivot
Daily PP
R1 Pivot
R2 Pivot
R3 Pivot
Gold Spot
1060
1070
1078
1088
1096
1106
1114

Gold Spot in Comex shows the emerging of the symmetrical triangle pattern. Prices have been oscillating between $1,110 and $1,080 per ounce levels since couple of week. Breakdown below $1,080 will bring the prices till $1,047 in near term.
Sustain below $1,080 will also indicate long term breakdown of the Bear Flag Pattern. Height of the Pole is 128 points, which is the difference from $1,205 to $1,077 level. Taking in to consideration the positional chart the lower side target comes to 1016 which is 50% of the height of the pole and Second target comes to $952 will be the 100% of the Height of the pole.
The strong US dollar and excess supply concerns are putting pressure on gold prices. The Federal Reserve’s interest rate hike would be the key driver for gold prices in the near term.
Fundamental News which just coming out from the Federal Reserve board voting member which will impact the prices to great extent
On Wednesday gold prices eased its previous session gain in Asia trade after remarks from a Federal Reserve board voting member that a widely expected rate hike this year could be "close". 

A voting member this year, Atlanta Fed's Lockhart is considered to be a moderate, analysts said, which made his remarks more meaningful. Talking with the Wall Street Journal, Atlanta U.S. Federal Reserve Bank President Dennis Lockhart said the Fed was "close" to being ready to raise short-term rates. Lockhart noted it would take major weakness in the data to convince him not to move. "I think there is a high bar right now to not acting, speaking for myself," he said. The Atlanta Fed president is a voting member on rate policy this year. He is seen by Fed watchers as a key bellwether of the thinking of the majority on the U.S. central bank due to his pragmatic approach to economic issues.