
Wednesday, June 18, 2014


Monday, June 16, 2014
USDINR Positional Report Elliot wave pattern formation
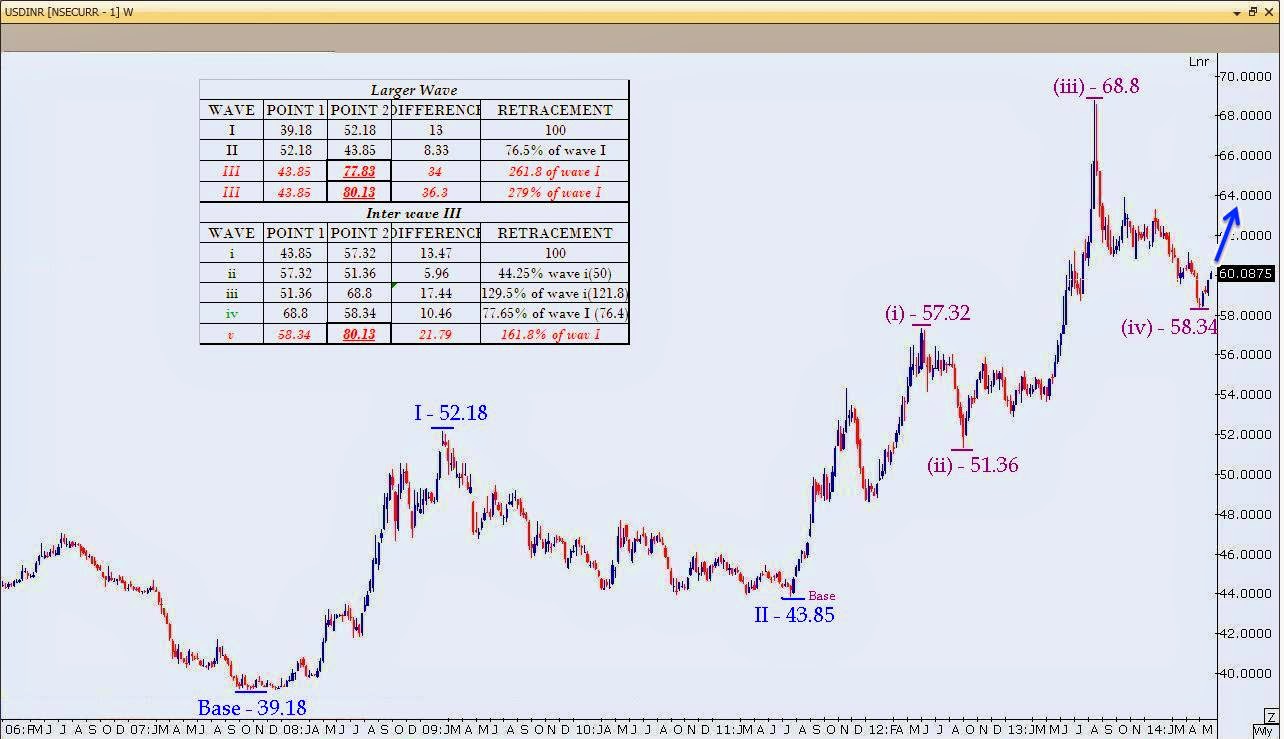
USD/INR Buy CMP 60.1 Stop
@ 58 TGT 64 – 68 – 72 – 76 – 80
The basic pattern of the Elliott wave
principle, how price moves not in a straight line but in a series of
rises and retracements. Except for unusual circumstances, price moves in
waves and not in a straight-line run. These waves are like the tide coming in.
Price advances and recedes, advances a bit more and recedes, slowly creeping up
the shore.
USDINR
from the above weekly chart from 30th November bottom of 39.18
started the rally where it tested the higher level of 52.18 in market 2009
where the top was posted. This was the first wave in the long term uptrend
where the rise in price was seen by 13 Rs. After testing the level of 52.18 corrections
in the form of wave II was seen and rupee retraced from 52.18 to 43.85 which
was 64.07% which was near to 61.8% level, which confirm correction was over and
it entered in wave III on 29th July 2011 which is still in continuation.
In the wave III we are looking at the inter wave formation where the inter
wave, the formation of wave (iv) is near to over and is entering in wave (v)
which is starting from recent bottom of 58.34 level. In the graph it is clearly
shown the movement of wave (iv) and the expected wave (v) can retrace by 161.8%
of wave (i) which comes to 21.79 points move from 58.34 and can move and test
the level of 80.13 level on higher side. This expected level of 80.13 will complete
the inter wave (v) and also the completion of wave III in larger wave. Wave III
might either close near to 77.83 which comes to 161.8% of wave I or 80.13 which
is 161.8% of wave (i) from bottom of wave (iv); where we can conclude wave III
in larger wave can come to end near to 78 to 80 range there after wave IV can
come in to picture.
Over here
we expect wave IV to retrace by 61.8% of wave I which will test 72 from the higher
level of 80.13 and thereafter from the lower level of 72 will enter in the wave
V moving and testing the level of 93.03 which is calculated on the basis of
161.8% of wave I from the bottom of wave IV and will halt around that level
before entering in corrective formation of A-B-C wave.
o
Rule:
·
Wave III must be 1.5 & 3.5 times
Price of wave I; Wave III must be 1 to 4 times the time wise by wave I; Wave
II and wave IV usually alternate between
·
Zigzag and Flat. The other
alternative is between a Triangle and a Flat. Wave V will usually move beyond
the end of wave III.
·
When Wave 5 is extended (more than 161.8% longer than both Waves
1 and 3) a point within Wave 4 will often divide the entire Impulse Wave by
1.618.
·
It is unusual for Wave 5 to travel a greater price or time
percentage than Wave 3 traveled in its entirety.
·
One of the Impulse Waves (Waves 1, 3 or 5) generally extends (at
least 162% times the next longest Impulse Wave).
·
Wave 5 must move by price more than 70% of wave. (This is not
gross movement. Only consider the end points of both 1 and 3 waves.)
Friday, June 13, 2014
One Pager Report on DE30 (DAX)

DAX (DE30) Sell below 9900
CMP 9930 Stop @ 10050 TGT 9300 – 8700 - 8028
The
basic pattern of the Elliott wave principle, how price moves not in a straight
line but in a series of rises and retracements. Except for unusual circumstances, price moves in waves and
not in a straight-line run. These waves are like the tide coming in. Price
advances and recedes, advances a bit more and recedes, slowly creeping up the
shore. The outgoing tide shows the wave advance not as far as previous waves,
and withdrawing further. The motive phase is composed of three advancing waves,
1, 3, and 5 and counter trend waves 2 and 4. Following the motive wave comes
the corrective phase. It shows two receding waves, A and C, with a counter
trend wave between, B. The series, 1 through 5 and A through C can be repeated
to show how the tide comes in, or price advances up the chart. If you were to
zoom in on waves 1 and 2, you would see the same 1 through 5 and ABC
combination. You can say the same about waves 3 and 4, 5 and A, B and C (with
the structure reversed). In this manner, the cycle is fractal, meaning the
closer you zoom in, the more motive and corrective phase combinations you see.
If you were to zoom out, say look at the structure from across the room or from
the other side of your yard, the 1 through 5 and ABC combination would take
shape of waves 1 and 2.
From the above monthly chart of DAX (DE30), it started its rally from 2003
bottom from the lower level of 2190 and continues its rally testing the level
of 8150 by year end 2007 December where it formed Double top and in 2008 Circes
sharp correction was seen. This was the correction of the rally in the form of
wave II and tested the lower level of 3590 which was exactly 76.4% retracement
of wave I. after the correction we have again seen the upside move in the form
of wave III and in this wave III there are inter wave where in inter wave also
wave iii is near to completion. Inter wave I started from 3590 and tested the
level of 7600 and from 7600 the correction what we have seen is the wave ii
testing the support of 4965, which is 59% retracement of wave I, near to 161.8%
retracement level. Wave iii testes the level of 10033 which was 121.8%
retracement of wave i and confirming the reversal in the price are expected.
Now if recent high of 10033 is holding will enter in wave iv of inter wave and it’s
expected to test the level of 8028 which we expect 50% retracement of wave i
and holding the high of wave i above 7600 and enter in wave v of inter wave III
and completion of wave III can be seen at 12050 which is 100% retracement of
wave I from the bottom of wave II, which
is expected in long run where.
UK100 Indices Symmetrical triangle pattern. Target 6675

UK 100 Sell Below 6800
CMP 6830 Stop @ 6875 TGT 6725 - 6675
A
Symmetrical Continuation Triangle (Bearish) is considered a bearish signal,
indicating that the current downtrend may continue.
Description
A
Symmetrical Continuation Triangle (Bearish) shows two converging trendlines,
the lower one is ascending, the upper one is descending. The formation occurs because
prices are reaching both lower highs and higher lows. The pattern will display
two highs touching the upper (descending) trendline and two lows touching the
lower (ascending) trendline. This pattern is confirmed when the price breaks
out of the triangle formation to close below the lower (ascending) trendline.
Target Price
The
target price provides an important indication about the potential price move
that this pattern indicates. Consider whether the target price for this pattern
is sufficient to provide adequate returns after your costs (such as
commissions) have been taken into account. A good rule of thumb is that the
target price must indicate a potential return of greater than 5% before a
pattern should be considered useful. However you must consider the current
price and the volume of shares you intend to trade. Also, check that the target
price has not already been achieved.
UK100 is forming Symmetrical triangle pattern formation from the
high of 6895 and support of 6771 and after it enter in the range bound, where
it made lower top and higher bottom formation. It’s nearing the lower support
level of 6800 and sustain below 6800 on closing basis it will give a
confirmation of the breakdown of the triangle. Height of the triangle comes to 124
points (6895 - 6771) and calculation the target from the breakdown point of 6800(6800
- 124 = 1217) expected target comes to 6676$ in near to medium term. Below 6676
might go and test the previous bottom of 6550 – 6500 level.
Tuesday, June 3, 2014
Bank nifty forming Head & Shoulder pattern in intrday 3 min time frame for 14900 target CMP is 14240
bank nifty in intraday 3 min chart time frame forming Head& Shoulder Pattern where neck line is coming at 15180 and sustain below the same will give the down side breakdown and can move and test the support level of 14900 immediately, on higher side resistance and stop of 14400 is advise ,, Rajeev darji +91-9820987859

Tuesday, May 27, 2014
Symmetrical Triangle Pattern Formation in GOLD

GOLD Sell Below 1285 CMP
1287Stop @ 1300 TGT 1265 – 1245 – 1217
A
Symmetrical Continuation Triangle (Bearish) is considered a bearish signal,
indicating that the current downtrend may continue.
Description
A
Symmetrical Continuation Triangle (Bearish) shows two converging trendlines,
the lower one is ascending, the upper one is descending. The formation occurs
because prices are reaching both lower highs and higher lows. The pattern will
display two highs touching the upper (descending) trendline and two lows
touching the lower (ascending) trendline. This pattern is confirmed when the
price breaks out of the triangle formation to close below the lower (ascending)
trendline.
Target Price
The
target price provides an important indication about the potential price move
that this pattern indicates. Consider whether the target price for this pattern
is sufficient to provide adequate returns after your costs (such as
commissions) have been taken into account. A good rule of thumb is that the
target price must indicate a potential return of greater than 5% before a
pattern should be considered useful. However you must consider the current
price and the volume of shares you intend to trade. Also, check that the target
price has not already been achieved.
Gold is forming Symmetrical triangle pattern formation from the
high of 1331 and support of 1268 and after it enter in the range bound, where
it made lower top and higher bottom formation. It’s nearing the lower support level
of 1285 and sustain below 1285 on closing basis it will give a confirmation of
the breakdown of the triangle. Height of the triangle comes to 68 points (1331 –
1268) and calculation the target from the breakdown point of 1285 (1285 -68 =
1217) expected target comes to 1217$ in near to medium term.
Friday, May 23, 2014
One Pager Positional Report on WTI OIL

WTI OIL BUY @ 104 CMP stop
@ 101 TGT 108 – 111 :- Wave III
completion
The basic pattern of the Elliott wave principle, how price
moves not in a straight line but in a series of rises and
retracements. Except for unusual circumstances, price moves in waves and not
in a straight-line run. These waves are like the tide coming in. Price advances
and recedes, advances a bit more and recedes, slowly creeping up the shore. The
outgoing tide shows the wave advance not as far as previous waves, and
withdrawing further. The motive phase is composed of three advancing waves, 1,
3, and 5 and counter trend waves 2 and 4. Following the motive wave comes the
corrective phase. It shows two receding waves, A and C, with a counter trend
wave between, B. The series, 1 through 5 and A through C can be repeated to
show how the tide comes in, or price advances up the chart. If you were to zoom
in on waves 1 and 2, you would see the same 1 through 5 and ABC combination.
You can say the same about waves 3 and 4, 5 and A, B and C (with the structure
reversed). In this manner, the cycle is fractal, meaning the closer you zoom
in, the more motive and corrective phase combinations you see. If you were to
zoom out, say look at the structure from across the room or from the other side
of your yard, the 1 through 5 and ABC combination would take shape of waves 1
and 2.
From the above
chart WTI OIL after testing the lower support at 91.75 forming Double Bottom
formation and reversal in price was seen and also have crossed the neckline at
100$ and tested the higher level of 105 from where short profit booking was
seen. Rise in price from 91.4 to 105.2 can be consider as wave I of the Elliot
wave theory and there after correction pattern tested the level of 97 in form
of wave II which was near to 61.8% retracement of wave I which was coming at
96.3, but price reverted from 97 and in showing formation of inter wave of wave
III. It in inter wave its again in (iii) wave where the expected target comes
to 108$ and after a short dip till 106$ in form of wave (iv) will again move to
test the level of 111 – 112$ where the inter wave (v) will get over with larger
wave III.
Subscribe to:
Posts (Atom)